
Energy & Sustainability
How much energy can smart building controls save?
What published controls savings figures mean and how to build a credible estimate for one building without double counting.
Value comes from technology aimed at an expensive, persistent problem in your own building, not from a generic top-ten list.
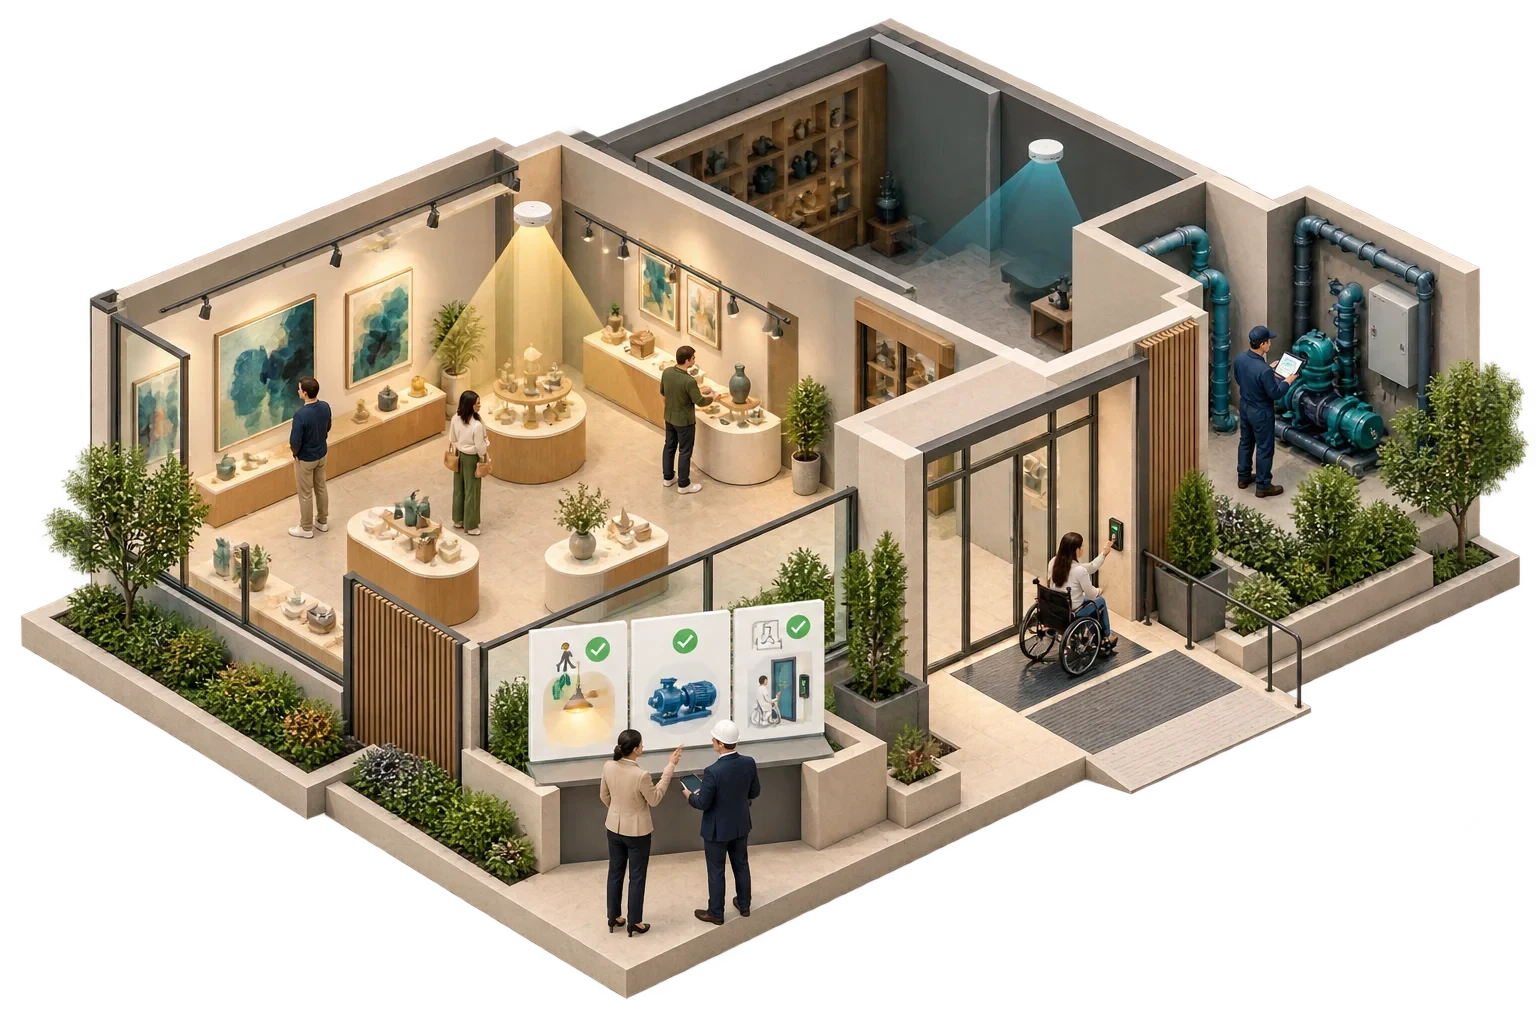
The technologies that pay their way are the ones aimed at an expensive, persistent operating problem in your building, fed by data good enough to act on, and backed by a team that will act. In many existing commercial buildings that points first to unglamorous work: correcting and recommissioning controls, fault detection and diagnostics (FDD), better metering, and a working link between alarms and maintenance. Occupant apps, digital twins and advanced AI can be valuable too, but they generally depend on those foundations already being in place.
There is no universal ranking. A short list only becomes defensible once it is built from the building's own baseline.
Public research gives a useful sense of scale, provided it is read carefully. The US Department of Energy puts the average potential of high-performance control sequences at around 30% of annual HVAC energy in commercial buildings. That describes what better sequences can achieve across the stock; a forecast for any one building has to come from that building's own systems and data.
The Department of Energy's Smart Energy Analytics Campaign, which covered thousands of buildings, documented energy savings from building analytics, with tools that diagnose faults doing better than those that only display data. Operations and maintenance tell a similar story. The DOE Federal Energy Management Program's O&M Best Practices Guide (Release 3.0, 2010) estimates that O&M programmes aimed at energy efficiency can save 5% to 20% on energy bills without significant capital investment. It is an older guide and its figure is a broad range, but the principle holds: good operation is often the cheapest improvement available.
These numbers are not interchangeable. The controls figure describes energy, while the O&M estimate is expressed as a share of energy bills and so already depends on tariffs. Your own estimates should keep energy and cost savings apart, treat service quality, equipment life and staff time as further, separate benefits, and never add them together as though they were one number.
The value is generally found in a familiar handful of places. One is equipment running when it should not: plant on outside occupied hours, simultaneous heating and cooling, schedules that someone overrode and nobody restored. Configuration changes and FDD often fix these. Closely related are faults that persist unnoticed, such as stuck valves, failed sensors and dampers that no longer modulate, which FDD combined with maintenance integration is designed to catch.
Then there is consumption nobody can explain. Without submetering, a large consumer may be invisible; metering saves nothing by itself, but it makes waste findable. Repeated manual work is another source, whether engineers walking plant rooms to read gauges or re-keying alarms into a maintenance system. And in some sectors the biggest prize is service failures that cost revenue. In a build-to-rent block, an apartment that cannot be re-let because a repair is outstanding has a value that energy metrics do not capture.
To compare candidates fairly, rank each against the same criteria on a scale from 1 (weak) to 5 (strong). On every criterion a higher score is better, so for delivery a 5 means high confidence and low risk.
| Criterion | What to ask |
|---|---|
| Problem value | How often does it occur, and what does it cost in energy, labour, revenue or risk? |
| Feasibility | Can the existing systems support it, or are significant works needed? |
| Data readiness | Are the required points available, accurate and identifiable? |
| Operational ownership | Is there a named person who will act on the output? |
| Delivery confidence | How little disruption does installation cause, and how mature is the product? |
Scroll horizontally to read the full table.
| Candidate | Value | Feasibility | Data | Ownership | Delivery confidence | Total |
|---|---|---|---|---|---|---|
| FDD on central plant and apartment fan coils | 4 | 4 | 3 | 4 | 4 | 19 |
| Alarm-to-work-order integration | 3 | 4 | 4 | 5 | 4 | 20 |
| Resident mobile app | 2 | 3 | 4 | 2 | 3 | 14 |
| Communal-area and amenity submetering | 3 | 4 | 2 | 3 | 5 | 17 |
Here the resident app scores lower not because it is a poor product, but because the operator has no clear owner for it and its value is uncertain. Maintenance integration and FDD rise to the top because the operator's immediate burden is repeated apartment faults and slow coordination. The app can come back later with a service case of its own.
The scores are there to structure the discussion. They do not settle it, and a single 1 for ownership or data readiness can outweigh strong scores everywhere else.
Licences are rarely the largest cost. Fault detection may need repaired sensors and correctly mapped points; occupancy-led control needs tuning and arrangements for staff overrides; maintenance integration needs a consistent asset register across two systems. These enabling tasks belong in the business case, and the options should be compared over the same evaluation period, with installation, commissioning, subscriptions, support and eventual replacement all included.
On the benefits side, keep avoided energy and maintenance spending separate from staff capacity released, and both separate from service improvements. Released hours only become a cost saving if the organisation actually redeploys or reduces them.
Before a large commitment, test the assumption that most affects the case. If the question is whether FDD will find enough actionable faults, run it on a representative system for an agreed period and count the faults found, fixed and verified. Judge the results against a baseline adjusted for weather and occupancy, because a straight comparison with last year's bill can mislead.
A prioritised technology roadmap, for one building or a portfolio, starts with exactly this exercise: four or five candidates, scored by the people who will operate them. Watch the ownership column: an option nobody will put their name to is not yet a candidate.
This article connects to our work on Building design.
We can discuss how this subject fits the project brief.
Contact Pagin Consulting