
Energy & Sustainability
What is continuous commissioning and how does it improve building performance?
What continuous commissioning is, how it differs from other commissioning approaches and what it takes to sustain.
Buy a fault resolution process, with data checks, priorities and closed faults as evidence, not only software.
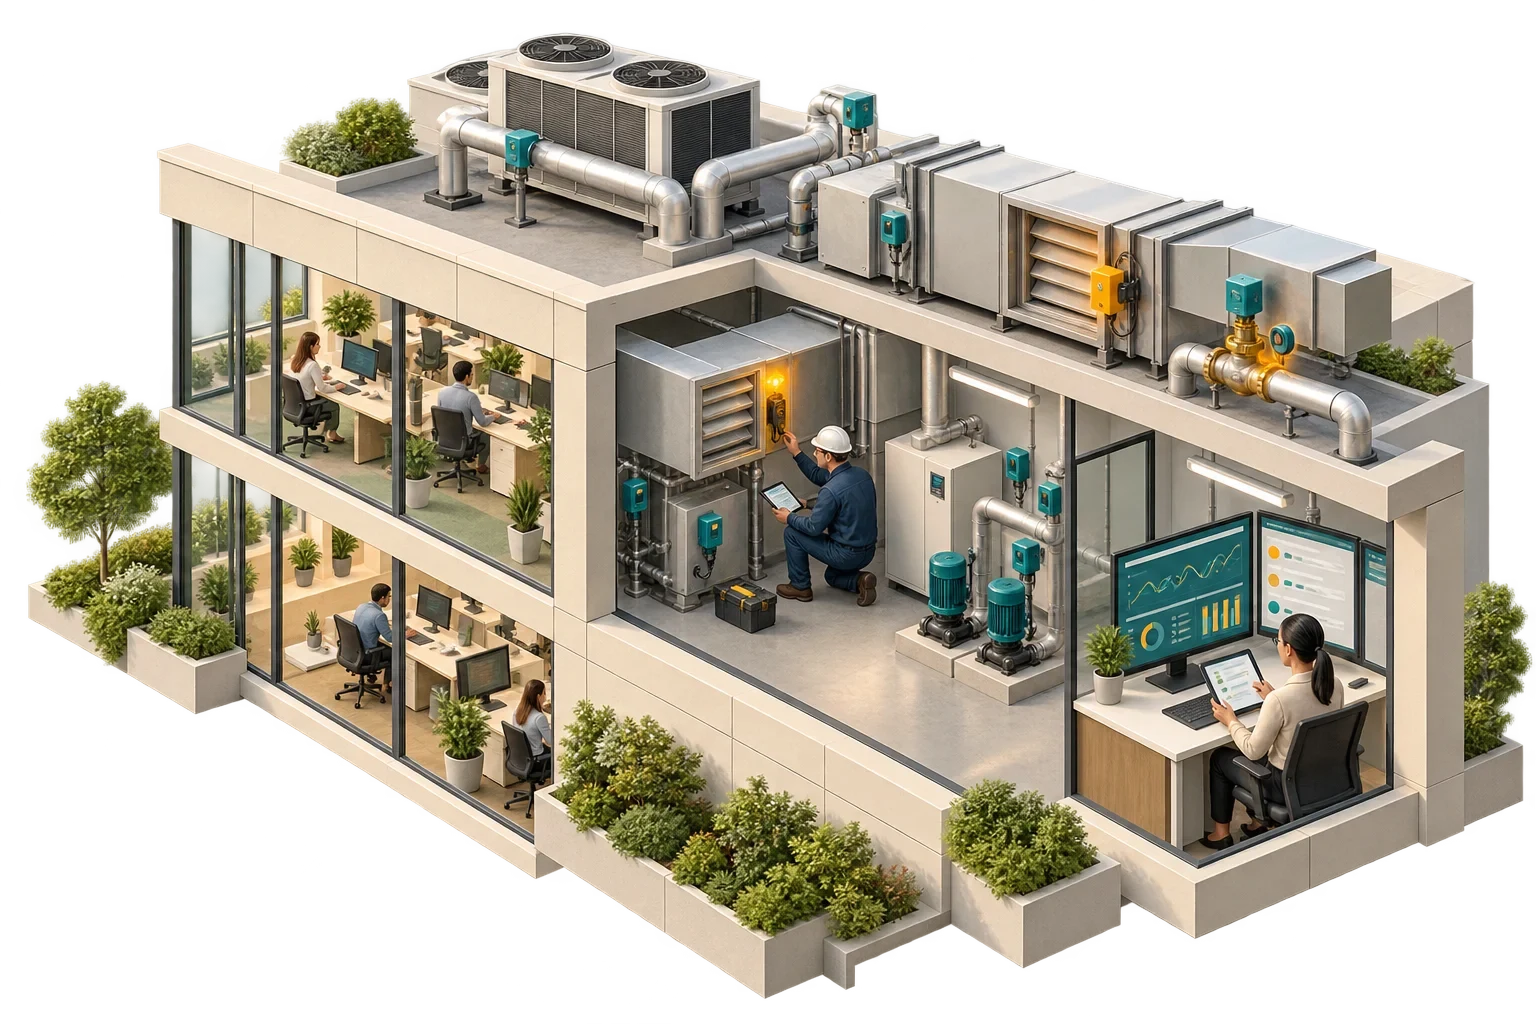
A fault-detection platform that produces hundreds of unresolved alerts does not save energy. It adds workload. Fault detection and diagnostics (FDD) software applies rules or models to building data, such as trends from the BMS, meters and sensors, to find patterns suggesting that equipment or controls are not working as intended, and to propose likely causes. It reduces waste only when its findings lead to a correction that sticks. What an owner is really buying, therefore, is a resolution process, of which the software is one part.
The US Smart Energy Analytics Campaign (2016–2020), covering 104 organisations and about 6,500 buildings, documented median annual energy savings of 9% for fault detection and diagnostics, compared with 3% for energy information systems that present data without automated diagnosis. Lawrence Berkeley National Laboratory's report on the campaign places these tools within monitoring-based commissioning, an ongoing commissioning process built on continuous monitoring and analysis of data, in which the tools organise, present and analyse it. The report also observes that building data do not typically lead to corrective action unless they are stored, organised, analysed and prioritised in automated ways. The medians are programme results across many organisations; they do not forecast any particular building.
FDD starts with trends from controllers, meters and sensors, mapped to the equipment they belong to. Rules, such as "valve commanded closed but coil leaving temperature rising", or statistical models then flag abnormal behaviour. The software proposes probable causes and, ideally, an estimate of the energy or comfort impact.
Up to this point, everything happens on a screen. The value is won or lost in what follows: a person investigates, raises the work and fixes the cause, and the data later confirms that the fault has gone and stays gone.
Wrong point mappings, sensor offsets, missing status points and inconsistent units produce diagnoses that are convincing and false. Before an FDD programme goes live, the mapping of points to equipment, and the calibration of the sensors that key rules depend on, should be verified. A structured semantic model, one that records which sensor belongs to which equipment and what it serves, makes rules reusable and reduces mapping errors.
Findings should be ranked by consequence:
| Factor | Question |
|---|---|
| Energy impact | How much energy is lost per day or week? |
| Comfort and service | Are occupants or processes affected? |
| Asset risk | Is the fault damaging equipment? |
| Confidence | How sure is the diagnosis? |
| Effort | Can it be fixed by a setting, or does it need parts? |
Related symptoms should be grouped, so that the team investigates one cause instead of acknowledging the same problem again and again.
Each actionable finding needs an owner and a route into the maintenance system or the controls contractor's work. The investigation, the correction and the evidence that it worked should all be recorded. The analytics provider and the operations team also need an agreed way to settle findings they disagree about. And reporting should count findings closed and energy recovered, not the number of rules or alerts.
Write the workflow, the service levels and the evidence of a closed fault into the contract with the same care as the software requirements. FDD depends on agreed diagnostic priorities and a working link to the maintenance system, and those are the parts Pagin Consulting helps owners set.
This article connects to our work on Sustainability.
We can discuss how this subject fits the project brief.
Contact Pagin Consulting